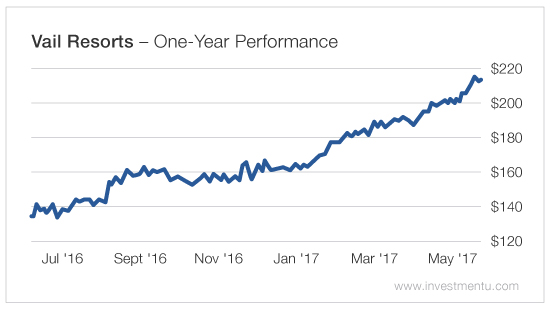
Vail Resorts Inc (NYSE:MTN) is a midcap company that operates within the hotels, restaurants and leisure industry. Its market cap is $9 billion today, and the total one-year return is 63.33% for shareholders.

Vail Resorts stock is beating the market, and it reports earnings tomorrow morning. But does that make it a good buy today? To answer this question, we've turned to the Investment U Stock Grader. Our Research Team built this system to diagnose the financial health of a company.
Our system looks at six key metrics...
✗ Earnings-per-Share (EPS) Growth: Vail Resorts reported a recent EPS growth rate of 15.17%. That's below the hotels, restaurants and leisure industry average of 80.37%. That's not a good sign. We like to see companies that have higher earnings growth.
✗ Price-to-Earnings (P/E): The average price-to-earnings ratio of the hotels, restaurants and leisure industry is 29.96. And Vail Resorts’ ratio comes in at 48.96. Its valuation looks expensive compared to many of its competitors.
✓ Debt-to-Equity : The debt-to-equity ratio for Vail Resorts stock is 74.68. That's below the hotels, restaurants and leisure industry average of 130.37. The company is less leveraged.
✗ Free Cash Flow per Share Growth : Vail Resorts’ FCF has been lower than that of its competitors over the last year. That's not good for investors. In general, if a company is growing its FCF, it will be able to pay down debt, buy back stock, pay out more in dividends and/or invest money back into the business to help boost growth. It's one of our most important fundamental factors.
✓ Profit Margins : The profit margin of Vail Resorts comes in at 20.57% today. And generally, the higher, the better. We also like to see this margin above that of its competitors. Vail Resorts’ profit margin is above the hotels, restaurants and leisure average of 8.23%. So that's a positive indicator for investors.
✗ Return on Equity : Return on equity gives us a look at the amount of net income returned to shareholders. The ROE for Vail Resorts is 15.44%, and that's below its industry average ROE of 20.6%.
Vail Resorts stock passes two of our six key metrics today. That's why our Investment U Stock Grader rates it as a Hold With Caution.
